Explore all the features of Baird 360 Wealth

The 360 Overview screen shows you a summary of your accounts, net worth as well as your current month spending, budget and cash flow.


On the Accounts screen, view all of your Baird and linked accounts in one single location.


The Transactions screen allows you to enter manual transactions, set rules for future transactions and implement multiple filters.


Within the spending section you can access a detailed view of either your income or expenses.


Get an overview of your cash inflow, outflow and net transfers on the Net Cash Flow screen.

Automatically tracks spending by category and sends notifications to help stay on track to improve financial health.

The Investments screen provides you with a detailed view of your investment allocations and positions across both your Baird and linked accounts.

Gain big picture insights with both your Baird and non-Baird accounts, to gain a big picture view of your finances.

Empower your personal wealth with Baird 360 Wealth

360 Wealth
360 Overview
Once you've enrolled in 360 Wealth, you will be taken to the 360 Overview screen where you will see a summary of your accounts, net worth as well as your current month spending, budget and cash flow.

Net Worth
The Net Worth widget shows your current net worth and it’s change in value since the last month. It also shows a Net Worth Over Time chart for the last 6 months.

Accounts
The Accounts widget shows you a list of all your accounts. It is the first widget on the dashboard.

Spending
Automatically tracks spending by category and sends notifications to help stay on track to improve financial health. Track your spending patterns and spot opportunities saving money making it easier to plan for major expenses, retirement, or debt repayment.

Investment Holdings
The Investment Holdings widget shows you an allocation breakdown of all your investments within 360 Wealth.

Cash Flow
See a quick glance of your cash flow for the last 4 months.

Recent Transactions
View your recent transactions across all your Baird and linked accounts.

360 Wealth
Accounts
On the Accounts Settings screen, view all of your Baird and linked accounts in one single location.

Group by institution, account type or account groups
Filter/group your accounts by using the toggles on the left.

Link Account
Easily link your external accounts by clicking the “Link account” button in the top right.

Accounts List
View a comprehensive list of all your Baird and linked external accounts.

360 Wealth
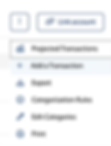
Transactions
View a summary of all your transactions by account. The Transactions screen allows you to enter manual transactions, set rules for future transactions and implement multiple filters to search for specific transactions.

Search and Filter
Easily search and filter across all your transactions with the toggles on the left.

Quick Actions
Easily add a transactions or export and print... plus more.
Transaction Details
See a list of all your transactions with the ability to view more details by clicking on the transaction description.

360 Wealth
Income & Expenses
Within the spending section you can access a detailed view of either your income or expenses.

Monthly breakdowns
Quickly see your monthly breakdowns with the widget on the right.

Expenses Chart
Easily view your expenses over time with a simple bar chart.

Income Graph
Easily view your income over time with a simple bar chart.

Top Expenses
Below the chart is a list of the top expenses for the month.

Expense & Income Toggle
Easily toggle the view between expenses and income with the toggle on the top left.

Filters
Easily filter your income and expense analysis by account and/or period.

360 Wealth
Cash Flow
Get an overview of your cash inflow, outflow and net transfers on the Net Cash Flow screen. Filter by time period, review cash flow details, and more.

Cash Flow Chart
View your cash inflow, outflow, net cash flow, and forecast over time across your Baird and non-Baird accounts.

Net Cash Flow KPIs
Check-in on your net cash inflow and outflow overtime, with average monthly cash flow summary.

Filters
Quickly drill down to specific accounts or groups by specific time horizons; this month, last month, 3 month, 6 months, This Year, 12 months, Last Year, or by Custom Dates.

Monthly Details
View your inflow, outflow, net transfers, and net cash flow by month.

360 Wealth
Budgets
Build a custom budget that allows you to track your income and expenses across multiple spending and income categories.

12 Month Chart
View and interact with your budget, income, and spending across all your accounts.

Budget Summary
Quickly check-in on your income and expenses over the last year.

Filters
Easily filter your budgets by account and/or period.

Category Breakdowns
Drill down into individual variable expense categories for a more detailed view into your spending.

360 Wealth
Investments
The Investments page provides you with a detailed view of your investment positions across both your Baird and linked accounts. Additionally, you can view asset allocation across all your investment accounts.

Asset Class Breakdown
View your holdings amount and percentage by asset class.

Investments Summary
View your current holding balance and your daily balance change percentage.

Dynamic Filters
Easily filter your investments by account and/or asset type.

Holdings Details
View a breakdown of positions by investment account.

360 Wealth
Net Worth
The Net Worth screen gives clients a summary of all their assets and liabilities for your Baird and linked accounts.

Net Worth Over Time Chart
The Net Worth Over Time chart visualizes how a client’s net worth has changed over time by charting total assets and liabilities alongside net worth, helping clients quickly track financial progress and trends across selected time periods.

Net Worth Summary
Shows a client’s current net worth, total assets, and liabilities along with the change over a selected time period for a quick view of overall financial progress.

Dynamic Filters
Filter by account and time period to view a more detailed breakdown of account data.

Assets & Liabilities Details
View a breakdown of your total assets and liabilities across all accounts.
